Para realizar ataques efectivos y silenciosos es crucial realizar una extensa fase de recogida de información sobre el objetivo con el fin de identificar los vectores de ataque. En este hipotético ejemplo vamos a analizar la seguridad de redes wireless utilizando técnicas de visualización.
To execute effective and covert attacks is crucial to perform an extensive information gathering phase of the target to identify the attack vectors. In this hypothetical example we are going to analyze the security of wireless networks using visualization techniques.
Para la fase de reconocimiento tenemos un amplio abanico de herramientas como son kismet, la suite de aircrack-ng, Netstumber, etc. Como siempre todas las herramientas tienen sus pros y sus contras y es una cuestión de gustos. Personalmente me gusta aircrack-ng y es la que vamos a utilizar para capturar la información en tránsito.
For the reconnaissance phase we have a wide range of tools such as kismet, aircrack-ng suite, Netstumber, etc. As always all tools have their pros and cons and it is a matter of taste. I personally like aircrack-ng and it is what we are going to use to capture the information in transit.
Partimos de que ya hemos capturado la información mediante airodump-ng y usamos una nueva herramienta llamada airgraph-ng incluida en la suite para visualizar la información. Para ello ejecutamos los siguientes comandos:
We assume that we have already captured information through airodump-ng and use a new tool called airgraph-ng included in the suite to display the information. To do this, we run the following commands:
Primero ejecutamos el programa airgraph-ng con el parámetro “-i” especificando el fichero obtenido mediante airodump-ng y con el parámetro “-g” con la opción “CAPR” que significa “Client – AP Relationship”, la relación entre clientes y AP.
Y éste es el resultado:
We first run the program airgraph-ng with the parameter “- i” specifying the file obtained from airodump-ng and with the parameter”- g” using “CAPR” which means “Client – AP Relationship”, the relationship between clients and AP.
And this is the result:
En la imagen podemos apreciar 2 Access Point (AP) protegidos mediante WEP 😉 y cada uno tiene un cliente asociado respectivamente. De forma rápida podemos analizar la información obteniendo número de AP, clientes, seguridad, canales y nombres de los AP.
Ahora hagamos lo mismo pero cambiando el parámetro “-g” por CPG que significa “Common Probe Graph”, para identificar los SSID que están buscando los clientes.
In the image we see 2 Access Point (AP) WEP protected 😉 and each has a customer associated respectively. Quickly we can analyze the information and grasp the number of AP, clients, security, channels, and names of the AP.
Now we do the same but changing the parameter “-g” to GPC which means “Common Probe Graph” to identify the SSID that clients are probing for.
Y ahora podemos ver lo siguiente:
And now we can see the following:
Los círculos blancos son clientes y los círculos azules son SSID. Si observamos la imagen podemos ver clientes que apuntan al mismo SSID, seguramente el AP al que están asociados, pero también podemos extraer más información interesante como dónde ha estado una persona por los SSID ya que revelan información geográfica. Podríamos empezar a crear un perfil del objetivo.
Airgraph-ng utiliza diferentes colores para los AP en función del método de encriptación como amarillo para WEP y rojo para AP abiertos.
The white circles are clients and the blue circles are SSID. If we look at the image we see clients targeting the same SSID, surely they are associated to that AP, but we can also draw more interesting information such as where a person has been by the SSID that reveal geographic information. We could begin to create a profile of the target.
Airgraph-ng uses different colors for the AP depending on the encryption method as red for open AP and yellow for WEP.
En la imagen podemos ver 6 AP y 7 clientes. Uno de los AP esta en rojo que significa que el AP está abierto y además vemos un cliente asociado 😉
Los fans de Maltego están de enhorabuena, ya que incorpora la capacidad de realizar análisis visuales de redes wireless en conjunto con aircrack-ng. Os mostramos el gráfico anterior mediante Maltego.
In the image we can see 6 AP and 7 clients. One of the AP is in red which means that the AP is open and we also see a client associated 😉
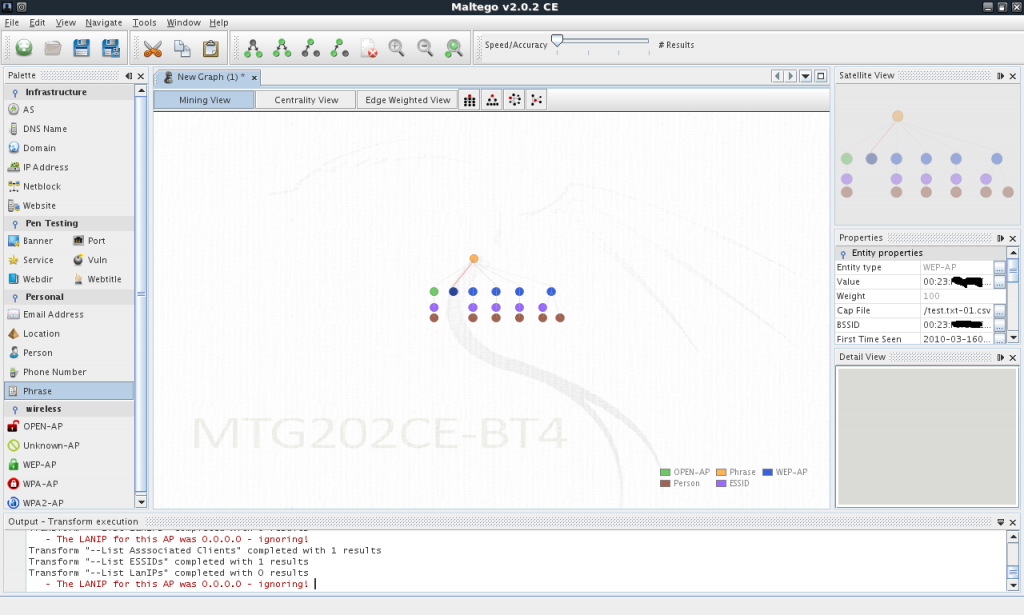
Maltego fans are in luck because it incorporates the ability to perform visual analysis of wireless networks in conjunction with aircrack-ng. We are using the previous graphic with Maltego.
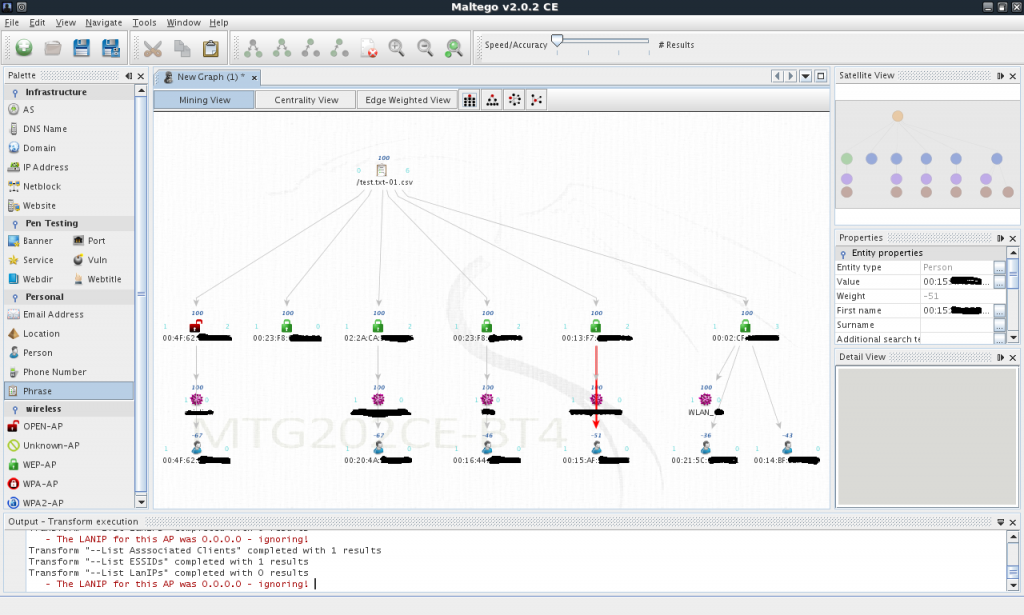
Donde vemos un AP abierto (verde), varios AP encriptados con WEP (azul) y clientes (marrón). Maltego proporciona un entorno ideal para realizar análisis de grandes cantidades de información y combinarlo con técnicas de Open Source Intelligence (OSINT). Haciendo un zoom podemos ver la imagen con mayor detalle.
We see an AP opened (green), several AP encrypted with WEP (blue) and clients (Brown). Maltego provides an ideal environment to perform analysis of large amounts of information and combine it with techniques of Open Source Intelligence (OSINT). Making a zoom we can see the image in greater detail.
Como podemos ver en el artículo las técnicas de visualización nos ayudan a ser más efectivos y reducir el tiempo de análisis significativamente. Ahora ya contamos con una visión de los vectores de ataque y podemos optar por diferentes estrategias como:
- Atacar el AP abierto
- Atacar alguno de los AP encriptados con WEP
- Atacar cualquiera de los clientes
- Meter un AP malicioso
- Interferir la comunicación entre AP y cliente
Una vez comprometido el AP o cliente podríamos continuar la intrusión combinando otros ataques de redes y sistemas para conseguir nuestro objetivo.
¿Qué técnicas de visualización y herramientas te gusta utilizar para tus análisis?
As you can see in the post visualization techniques will help us be more effective and significantly reduces analysis time. Now we already have a view of the attack vectors and we can choose different strategies such as:
- Attacking the open AP
- Attack any of the AP encrypted with WEP
- Attack any of the clients
- Put a malicious AP
- Jamming AP-client communications
Once the AP or client is owned we could continue the intrusion by combining other network and system attacks to achieve our objective.
What visualization techniques and tools do you use for your analysis?
— Simon Roses Femerling


